Project Overview

Salt Lake County oversees a vehicle emissions testing program to ensure compliance with federal air quality standards. Motorists annually spend millions of dollars for inspections carried out under this program.

However, it is not subject to cost controls and suffers from programmatic inefficiencies wherein a large number of compliant vehicles undergo testing and a small number of high-polluting vehicles forgo timely repair. Using survey-based emissions test pricing data, we assess through empirical and spatial autocorrelation analysis the potential economic impact of instituting both emissions test price caps and subsidies to fund compliance repairs.

We conducted two sub-projects: Project A - Economic revision of testing services price schemes; Project B - Modelling of emission test failures.


See Project Timeline

Introduction

The Salt Lake County vehicle emissions testing program suffers from uncontrolled transactional cost burdens for motorists and is not capable of tracking noncompliant vehicles. How can we leverage Salt Lake County test pricing and test results data to reduce cost inefficiencies for motorists and improve overall efficiency of the I/M program for local government? This project proposes to support Salt Lake County regulators in the exploration and development of policies aiming at establishing new cost efficiencies and improving overall efficiency of the program through exploration of repair incentives.

Through empirical and spatial analysis of service provider-level and vehicle-level data, we sought to identify testing price points that can accomplish a decrease in cost per ton of reduced pollutant emissions while preserving adequate geographic service availability within the County.

Raw Data

1.County-wide testing service provider records dataset
The dataset contains average per-station testing price data for the first two months of 2019 including 435 rows of detail for each test station within Salt Lake County: a unique station ID, test fees, the station name, and street address along with city name and zip codes. The data are limited in that they do not contain point geographies, detail on any additional taxes and fees, and station type categorization. This initial dataset was limited in that it did not contain point geographies and applicable fees or tax additions to prices, nor did it discern service providers offering test services from those that supplement testing with repair services.
2.Survey resulting dataset
The resulting dataset provided the population of test providers from which we later drew a stratified simple random sample of 35 providers to conduct the more detailed price cap and repair subsidy survey. This data also supported the public-facing interactive web application that allows county motorists to explore test provider location and price details.
3.Specific-vehicle emissions testing results dataset
The dataset contains 1.646 million observations on individual emissions tests for years 2017 and 2018, covering vehicle characteristics of model year, type, class, and weight, and test parameters of test station ID, location, type, and test result. The station ID key permitted a join to the original pricing dataset containing geocoded point locations, thus permitting removal of the hard-to-standardize location variables.

Methodology

1. Stratified sampling and phone call survey
Our sampling plan and survey questions focused on three objectives: assessing the viability of a price cap for all emissions tests in Salt Lake County; assessing how many stations would still offer testing at a price of 15 dollars; and assessing the providers’ interests in participating in a program subsidizing needed repairs to comply with emissions. To ensure a geographically representative sample of the types of stations and different categories of repair providers, we employed a stratified random sampling method.
2. Modelling of emissions test failures
This entailed a high-level exploratory analysis spanning tests conducted through all of 2017 and 2018 at every station. The dataset contained independent variables detailing vehicle and testing characteristics and one categorical dependent variable with three values: test pass, test fail, and test rejected due to insufficient data from the vehicle’s onboard computer. Accounting for differences in testing requirements based on car age and inferring a minimum time elapse between yearly tests for older vehicles guided our process and gave us a higher degree of confidence in our findings.
3. Spatial analysis: Local Moran’s I and geographically weighted regression
To identify local patterns of spatial association between stations’ testing frequencies, we conducted Local Moran’s I analysis (Anselin 1995) and geographically weighted regression (GWR) using ArcGIS to explore the relationship between testing frequency and local population characteristics (Fotheringham et al. 2003).
4. Interactive map development and user experience testing
With the verified pricing data, we developed an interactive web application to display map-based pricing data using the Python Dash visualization framework. To optimize the end user’s interactive experience, we conducted two rounds of user experience testing.

Result

1. Discrepancies emerged between the prices contained in the County data and the prices facilities reported during data collection and verification of current pricing and services. Such differences suggest testing prices are dynamic and frequently modified. Our phone survey of testing providers revealed a generally negative attitude towards imposing a price cap, even though caps exist in neighboring counties. More than 62% of respondents claimed not to be willing to offer testing if a price cap were introduced. However, most respondents (60%) indicated a willingness to participate in a subsidized program designed to incentivize early repairs. The proposed price cap of 15 dollars, well below the current average price of 34 dollars.In contrast, imposition of a 30-dollar cap that is still lower than the current average price, while utilizing subsidies for an early repair program, improves both cost effectiveness and pollution reduction.

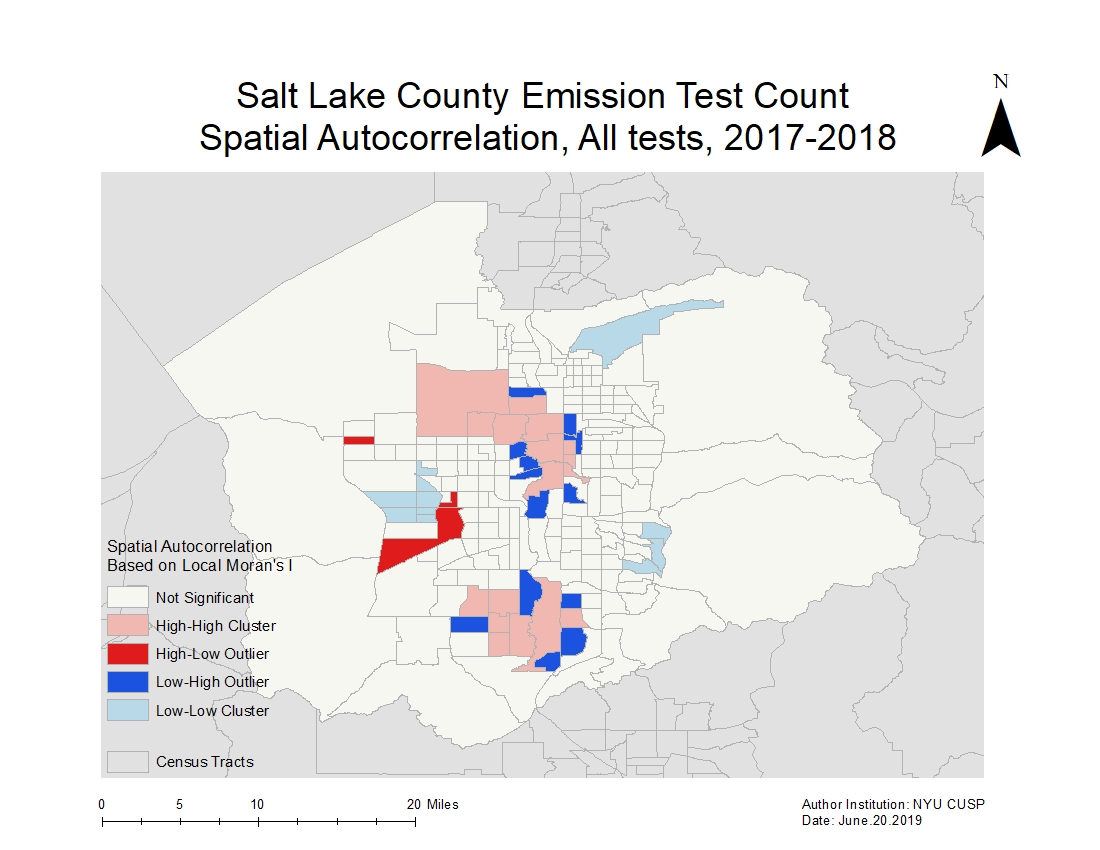
2. Spatial analysis of testing facilities and their corresponding test volumes reflected generally good spatial coverage across the county. Use of Local Moran’s I helped us identify regions were some disruption in availability could occur. We identified two statistically significant high emissions test frequency clusters, outliers with low test frequencies surrounded by high frequency values and outliers with high test frequencies surrounded by low frequency clusters. GWR results indicated no strong correlation between testing frequencies and population characteristics. From a policymaking perspective, these results, particularly the presence of two large high testing frequency/high population clusters, suggest adequate geographic availability.


3. Isolation of OBD tests on vehicles of model years 23 years and newer revealed a ~93% initial test pass rate, controlling for increased latitude in testing requirements of vehicles under six years of age. The high initial-test pass rate suggests the existing blanket approach requiring nearly all vehicles to undergo emissions testing is not a cost-effective method of pollution reduction.The development of methods to selectively identify that small proportion of vehicles most likely to be emissions violators and participants in a subsidized repair program would be a useful exercise in further research.

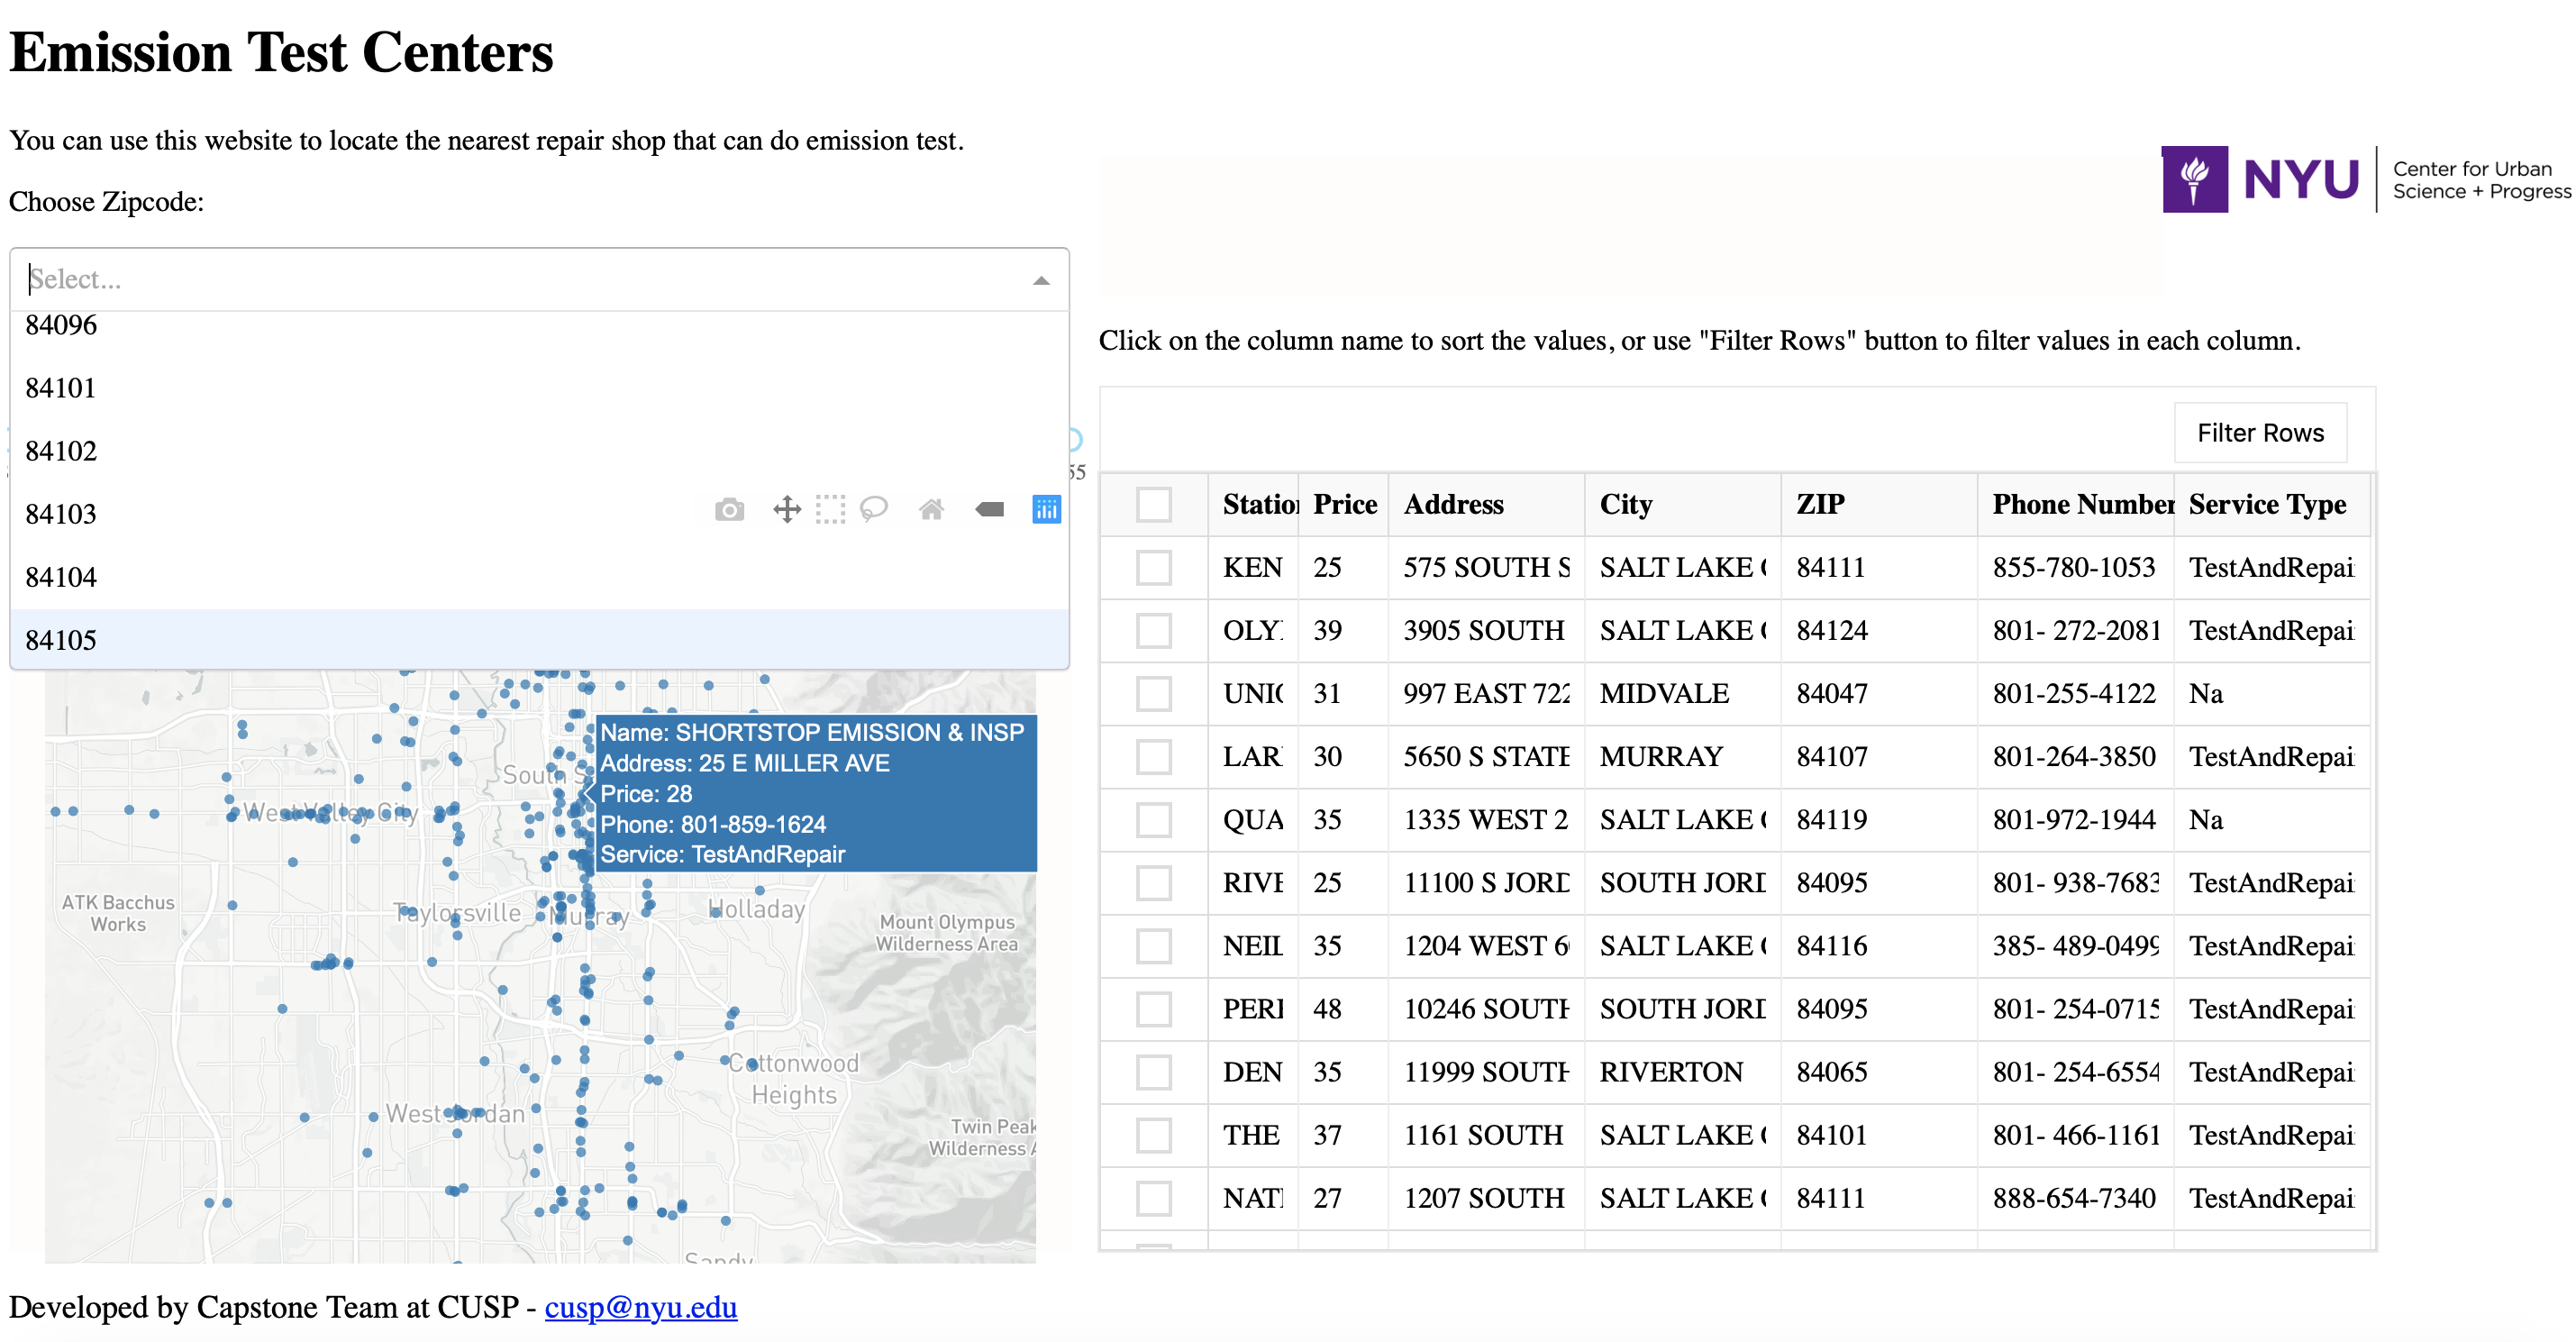
4. We built a prototype web application that displays locations of testing facilities with detailed information on each of them and filter feature based on zip code and price range.Application will be used by county residents and our intuition and domain knowledge of our mentor indicated that filtering specifically by zip code will allow users to quickly select the most convenient facilities, while price filter will add transparency to existing pricing schemes and provide a more informed and economically transparent facility selection process.


Conclusion

To improve the cost efficiency and programmatic effectiveness of Salt Lake County’s emissions testing program, we sought to identify emissions testing price points that can decrease costs to motorists per ton of reduced pollutant emissions while preserving adequate geographic service availability within the County.

  • Our survey results suggested the introduction of a price cap of 30 dollars and introduction of a subsidized early repair program would reduce the average testing price within the county while improving the program’s pollution-reduction effectiveness.
  • A high-level exploratory analysis of test data on vehicle-level data demonstrated that OBD tests on vehicles of model years 23 years and newer revealed a ~93% initial test pass rate.The high quality and detail inherent in the testing data make statistical modeling of emissions test results a useful starting point in further research.
  • Spatial analysis on testing data joined with census data revealed local patterns of spatial association between stations’ testing frequencies and population density, suggesting adequate geographic distribution of testing stations and moderate travel and transaction costs for motorists seeking test services.
  • Our development of an interactive web application featuring price and geographic filter functionality to provide county residents with a useful tool for identifying the most convenient testing facilities adds transparency to the existing pricing scheme.

References

Baltusis, Paul. On board vehicle diagnostics. No. 2004-21-0009. SAE Technical Paper, 2004.

Harrington, Winston, Virginia McConnell, and Amy Ando. "Are vehicle emission inspection programs living up to expectations?." Transportation Research Part D: Transport and Environment 5.3 (2000): 153-172.

Kuhns, Hampden D., et al. "Remote sensing of PM, NO, CO and HC emission factors for on-road gasoline and diesel engine vehicles in Las Vegas, NV." Science of the Total Environment 322.1-3 (2004): 123-137.

National Research Council. Evaluating Vehicle Emissions Inspection and Maintenance Programs. National Academies Press, 2001.

Pierce, Lamar, and Jason A. Snyder. "Discretion and manipulation by experts: Evidence from a vehicle emissions policy change." The BE Journal of Economic Analysis & Policy 12.3 (2012).

Group Members


Project Manager

Ewelina Marcinkiewicz

Ewelina Marcinkiewicz was responsible for setting measurable targets, intellectual progression of the project, and team management. She conducted multiple problem-solving sessions for the team to identify appropriate goals and methods for various aspects of the project. She handled internal and external communication, managed expectations, and overlooked team’s delivery. Ewelina took responsibility for design and execution of user experience testing for the web application, survey and analysis with testing facility managers, and delivery of key take-aways.

Linkedin Github

Data Visualization Lead

Yunhe Cui

Yunhe Cui was responsible for data visualisation and interpretation. The team will use ArcGIS desktop, HTML5, CSS, Tableau Public, CartoDB, and ArcGIS Pro to represent spatial and non-spatial data in maps and interactive charts. For project A, she geocoded the test station addresses.

Linkedin Github

Document Lead

Ursula Kaczmarek

Ursula Kaczmarek assumed responsibility for making the vehicle-level testing data suitable for exploratory analysis and modeling, using the Tidyverse data-cleaning package in R. She also performed exploratory analysis on these testing data, including identification of an appropriate algorithm for identifying per-vehicle initial test results. She performed a literature review on developments within the country’s vehicle emissions programs and price caps within regulated monopolies.

Linkedin Github

Web Application Lead

Jiawen Liang

Jiawen Liang was responsible for the web application development. He was responsible for designing a web application based on collected data which could help residents in Salt Lake County to locate the cheapest repair shop around them that can do the emission test. Jiawen created two prototypes of the application based on user experience test results.

Linkedin Github

Data Processing Lead

Jingxi Zhao

Jingxi Zhao was responsible for primary research data acquiring and processing. She led the team in verification of price-related data for 435 test stations and also supported the second round of survey for facility managers. She also deployed the web-based application on Heroku and assisted in building the project website using Javascript, HTML and CSS.

Linkedin Github